
The Statistics tab shows your current connection and the traffic and sessions Potatso recorded. Everything is recorded on your device while you're connected.
Time ranges
Choose a range at the top of the page:
| Range | Shows | Pro |
|---|---|---|
| Live | The running connection. Only while connected. | Some cards |
| Today | Today's traffic by hour, and today's sessions. | Connection quality |
| 7 Days | The last 7 days. | |
| 30 Days | The last 30 days. | Yes |
While you're connected, the page opens on Live. Otherwise it opens on Today.
Live
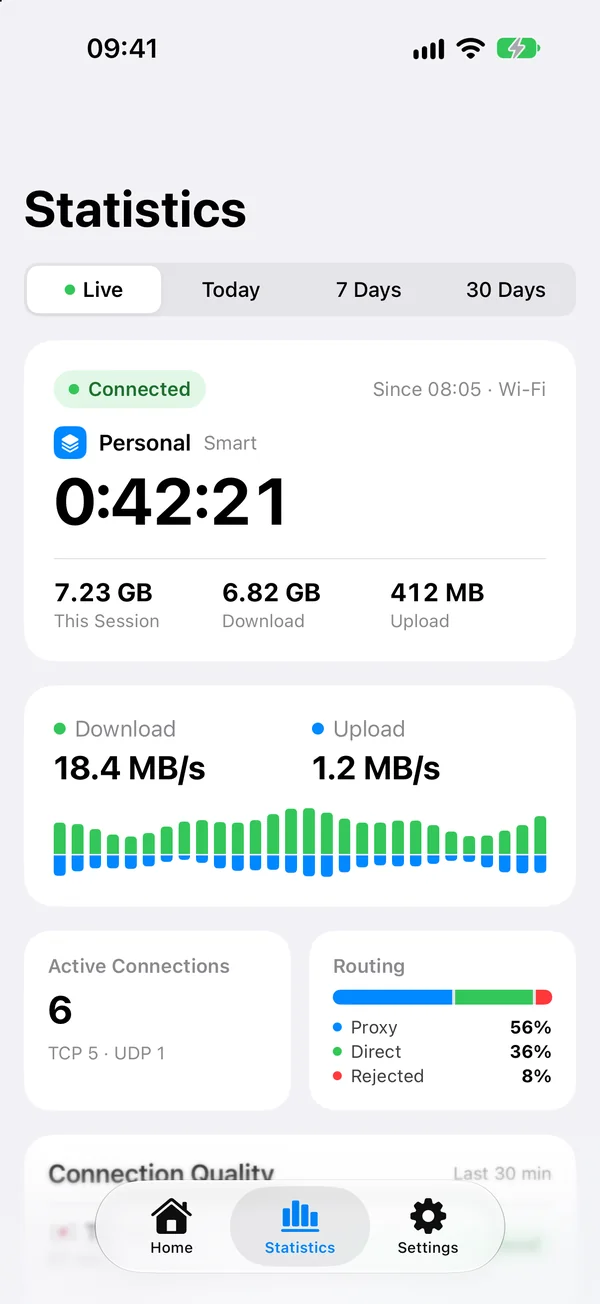
- Connected: when this session started and the networks it ran over, such as Wi-Fi or Cellular.
- Download and Upload speed over the last minute.
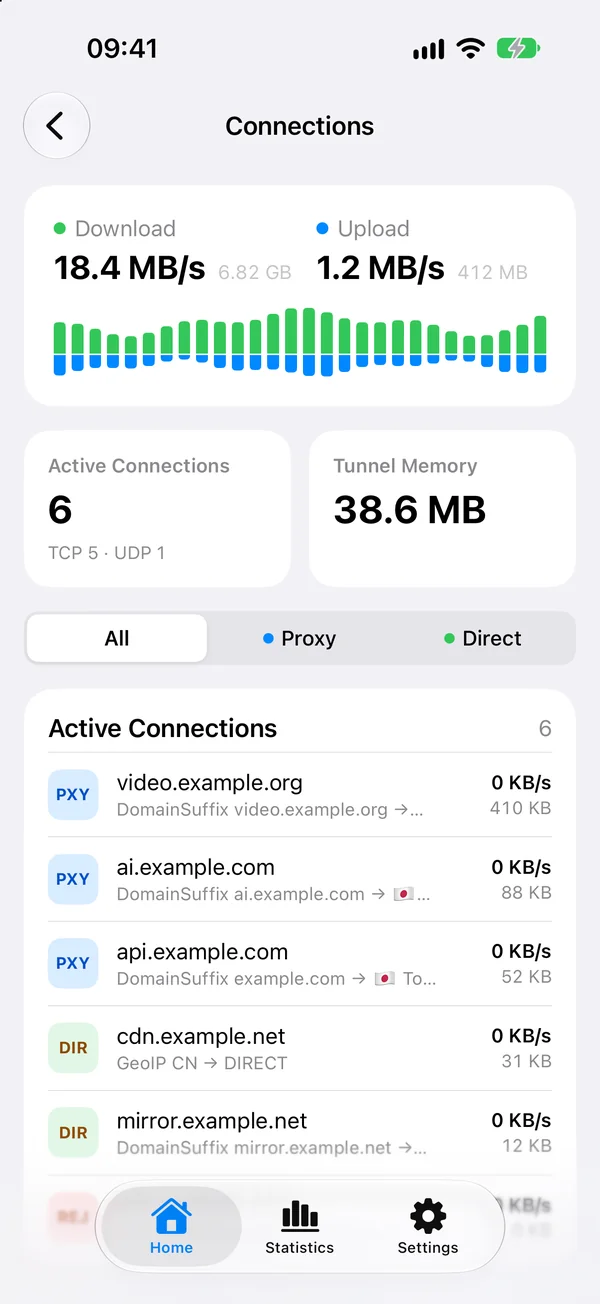
- Active Connections: how many connections are open, split into TCP and UDP. Tap it to see them.
- Routing: how this session's connections split between proxy, direct and rejected routes.
- Connection Quality (Pro): how the nodes in use did over the last 30 minutes, from the time their TLS handshakes took.
- Active Connections list (Pro): the fastest open connections, with the rule and node that took each one. Without Pro, you see the first connection. Tap All for the full list.
- Top Connections (Pro): today's busiest hosts, ranked by Count or Traffic. Without Pro, you see the first host.
Today
- Today's Traffic: download and upload by hour, compared with yesterday.
- Time Connected: how long you were connected today, and in how many sessions.
- Proxied: the share of connections that went through a proxy, and the share that went direct.
- Most Used Node: the node that carried the most traffic.
- Peak Hour: the hour with the most traffic.
- Network: how your traffic split between Wi-Fi, Cellular and Ethernet.
- Connection Quality (Pro): how many hours were as usual, hour by hour, on each kind of network, and Nodes Quality for each node.
- Session History: today's sessions. Tap All for older ones.
Connection quality compares each site with its own usual handshake time. A status is As Usual, Poor or Bad. It shows Calibrating until each site has had a few connections.
7 Days and 30 Days
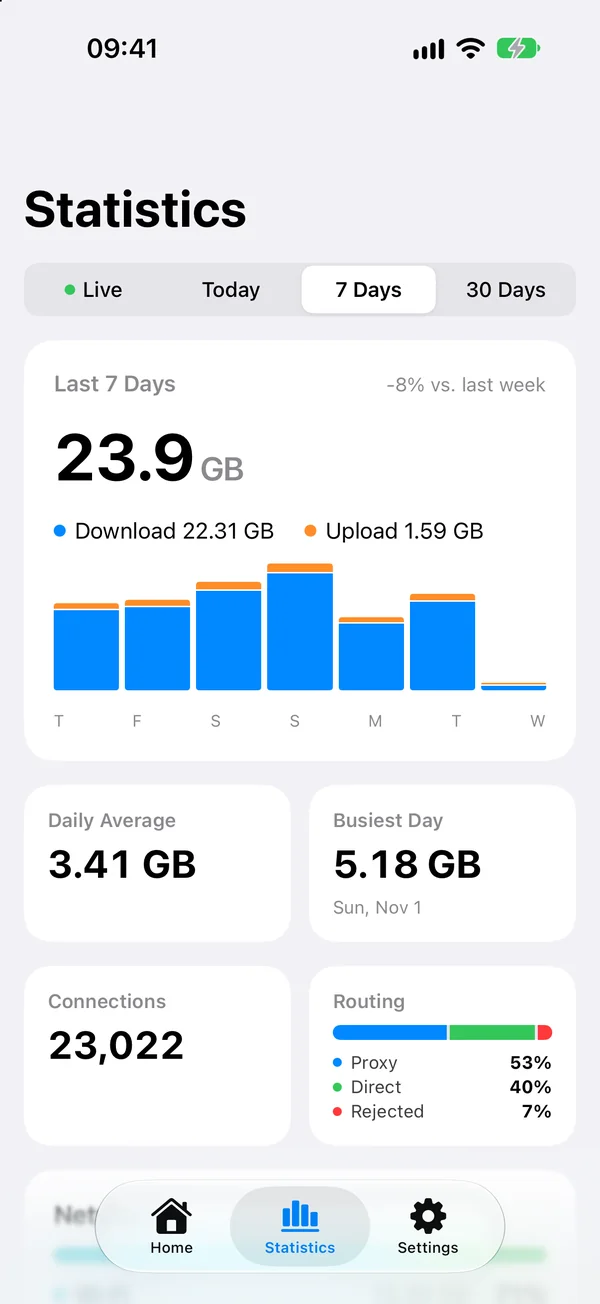
- The traffic chart for the range. 7 Days compares it with the week before.
- Daily Average and Busiest Day.
- Connections and Routing: how many connections were opened, and how they were routed.
- Network: the Wi-Fi, cellular and Ethernet split.
- Session History.
Sessions
Each time you connect, the session shows up in Session History. Tap a session to see its details, such as its traffic, its busiest hosts and how it ended.
Without Pro, you can see the sessions of the last 7 days. Pro keeps a year of sessions.
Clear history
To delete the recorded traffic, sessions and connection quality on this device:
- Open Settings and tap Connections.
- Tap Clear History and choose what to clear.